

Performance analysis – Indicators – OEE – KPI
Knowing your factory’s performance, monitoring it and improving it using production performance indicators: one of today’s major challenges
production performance indicators
Quality and industrial performance are part of the for continuous improvement of manufacturing processes (TPM approach : Toal Productive Management).
Understanding, monitoring and improving the process are key challenges for Production Managers. Continuously improving the quality of your products and the performance of your industrial equipment requires relevant analytical tools and indicators. With the MESbox QPI pack, you have a powerful calculation and monitoring module for OEE, Overall return, MTBF, MTTR, Quality rate…and all associated indicators, as well as the ability to easily create your own production performance analysis (Key Performance Indicators).
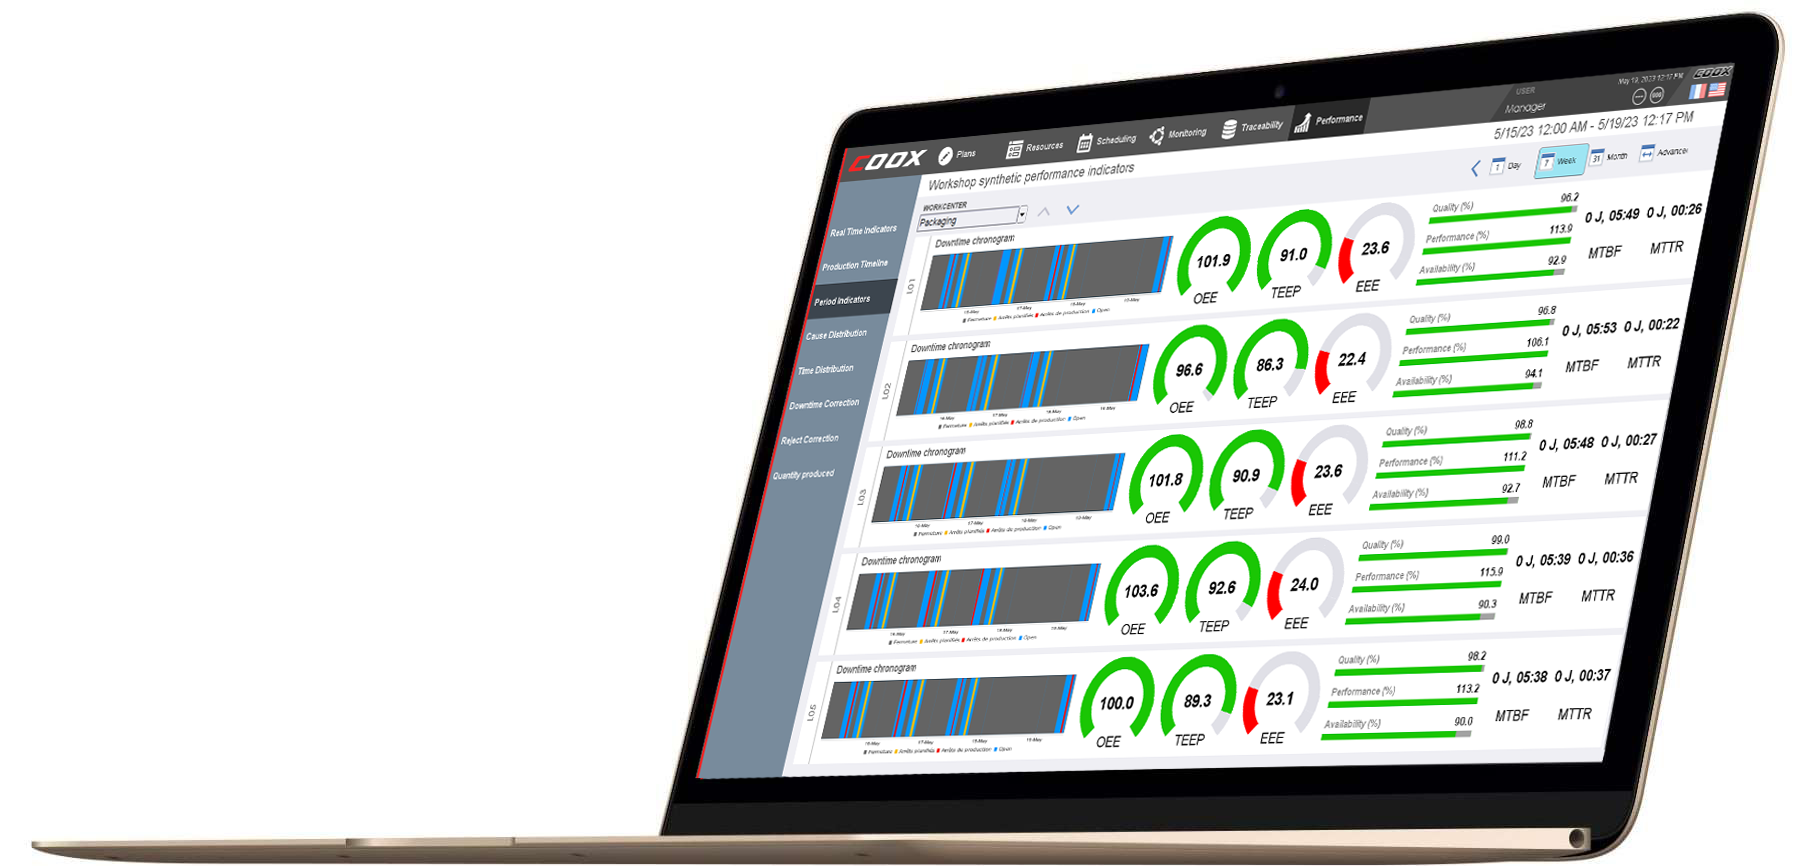
FOR THE MANAGER
COOX (COllaborative Operation & eXecution) offers customizable ready-to-use dashboards: real-time vision of the selected standard performance indicators and their evolution over time over the chosen period. Adjustable thresholds for each device set the acceptability and alert levels for the indicators. In one click you get a detailed analysis of the causes of shutdowns and rejects.
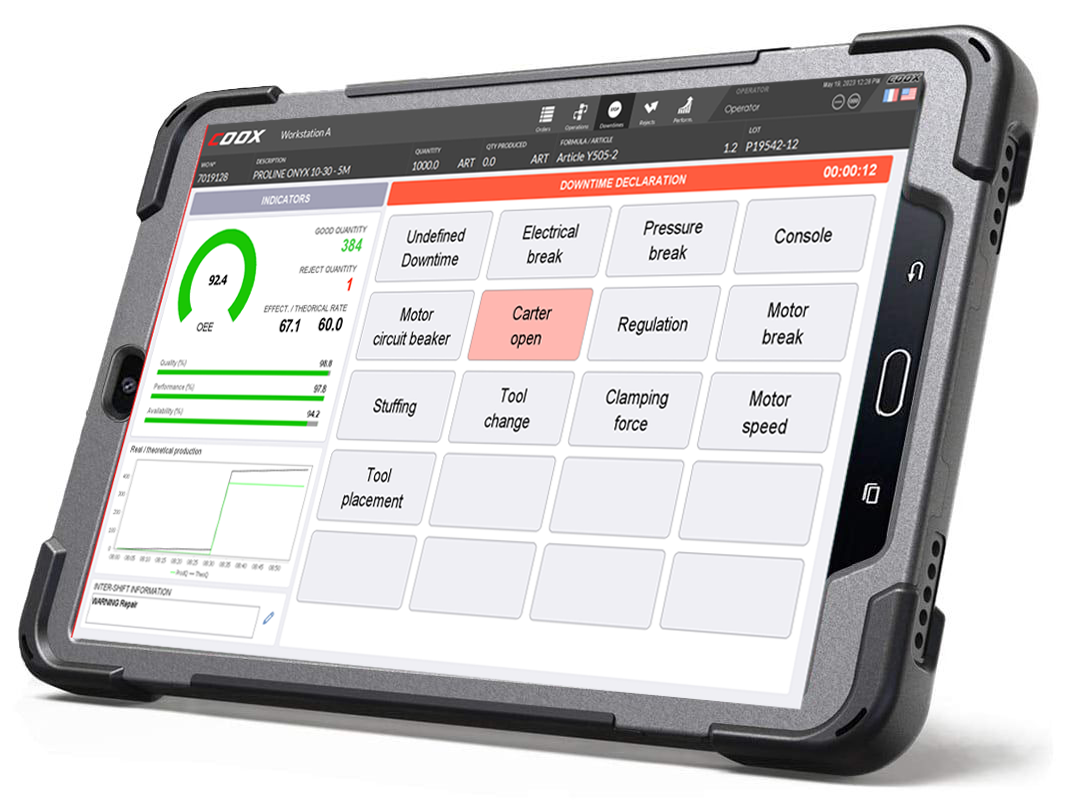
FOR THE OPERATEUR
The causes of shutdowns and rejects which are not provided directly by the machines are automatically counted by ergonomic tactile interfaces. No loss of production time for text or time input, and more risk of error. The operator has access to the main information of the team in real time and increases their motivation to achieve production objectives.
Today, manufacturers must achieve high performance rates. And we sometimes see that despite having invested heavily in their production tools, growth is not always forthcoming. To optimize industrial processes, it is necessary to collect information, either manually or automatically, and to process and consolidate it in a structured database format.
Whether through the calculation and monitoring of OEE (Overall Equipment Effectiveness), MTBF (Mean Time Between Failures), MTTR (Mean Time to Repair), etc., the results of these processes are reflected in production performance indicators (Key Performance Indicators) or reports. The indicators, reports, and assessments obtained are distributed to all operators and managers in an appropriate format.
What is OEE?
OEE (Overall Equipment Effectiveness) is the key indicator in industrial production. It shows whether production equipment is performing well and identifies losses responsible for non-productivity. It gives manufacturers ideas for optimizing and pursing a process of continuous improvement. This indicator is defined by the NF E60-182 standard as the ratio of useful time to required time and provides information on the percentage of time spent producing parts that meet quality standards over a given period.
It is customary to break down OEE as follows:
- Availability Rate (measures the percentage of scheduled production time during which the equipment is actually available for operation. Planned and unplanned downtime is taken into account.
- Performance rate (evaluates the rate at which products are manufactured compared to the maximum theoretical rate. This includes slowdowns and stoppages that do not result in a complete cessation of production).
- Quality Rate (measures the proportion of products manufactured correctly in relation to the total number of products manufactured, taking into account rejected products or those requiring rework.
OEE is equal to the product of these three indicators.
Two other rates are also useful for obtaining consistent industrial performance monitoring:
- The Overall Operations effectiveness (OOE)
- The Economic Rate of Return (EER)
The OOE is an economic indicator that encompasses all components of production: working time, number of compliant parts manufactured, load, and efficiency of the production tool. It describes the performance of a production tool as a percentage.
The EER, on the other hand, determines the production time of compliant parts in relation to the total production time and provides an overview of the potential profitability of an investment. By comparing the profitability of different investments, it allows manufacturers to identify the best opportunities.
However, OEE remains the key indicator as it measures performance, facilitates business management, and enables effective action plans to be put in place by making the right decisions.
It provides an overview of the overall performance of industrial equipment. OEE must be between 0 and 100%. The closer the OEE index is to 100%, the more efficient the machine or production line is.
An OEE of 100% means that production is running continuously.
Conversely, when the rate is lower, it indicates that there have been stoppages, periods of non-production, or unexpected slowdowns. These can include operational anomalies, a lack of parts or raw materials, poor resource allocation or staff shortages, overly long series changes, planned or unplanned stoppages (maintenance, supplies, checks, breakdowns, etc.).
As you can see, measuring OEE is above all about being able to identify the causes of OEE losses in order to specifically seek to improve and increase the overall efficiency of the factory.
Increasing the Overall Equipment Effectiveness is therefore essential to remain competitive and achieve objectives by maximizing equipment performance. For a manufacturer, monitoring this indicator means putting all the odds in their favor by acting on the right levers for improvement and committing to a sustainable, structured, regular, and effective continuous improvement process.
By reducing costs, malfunctions, scrap, time per unit produced, and optimizing OEE, manufacturers have a strategic lever to increase the productivity and profitability of their facilities.
AUTOMATIC ACQUISITION AND CALCULATION
Time is precious, and manufacturers should not waste it performing all kinds of calculations.
Using information acquired automatically (from a programmable logic controller or an input/output device) or manually, the MESbox QPI package calculates OEE and ORR directly and in real time, along with all their reference times, and provides the rates used to calculate OEE.
The MESbox QPI also provides MTBF (mean time between failures) and MTTR (mean time to repair) indicators as standard. The calculations performed for all these indicators can be customized.
For automatic acquisition, OPC, TCP/MODBUS, and JBUS/MODBUS communications are provided as standard. The data collected (quality control results, measurements, product counts, material consumption, etc.) is automatically recorded in a standard database.
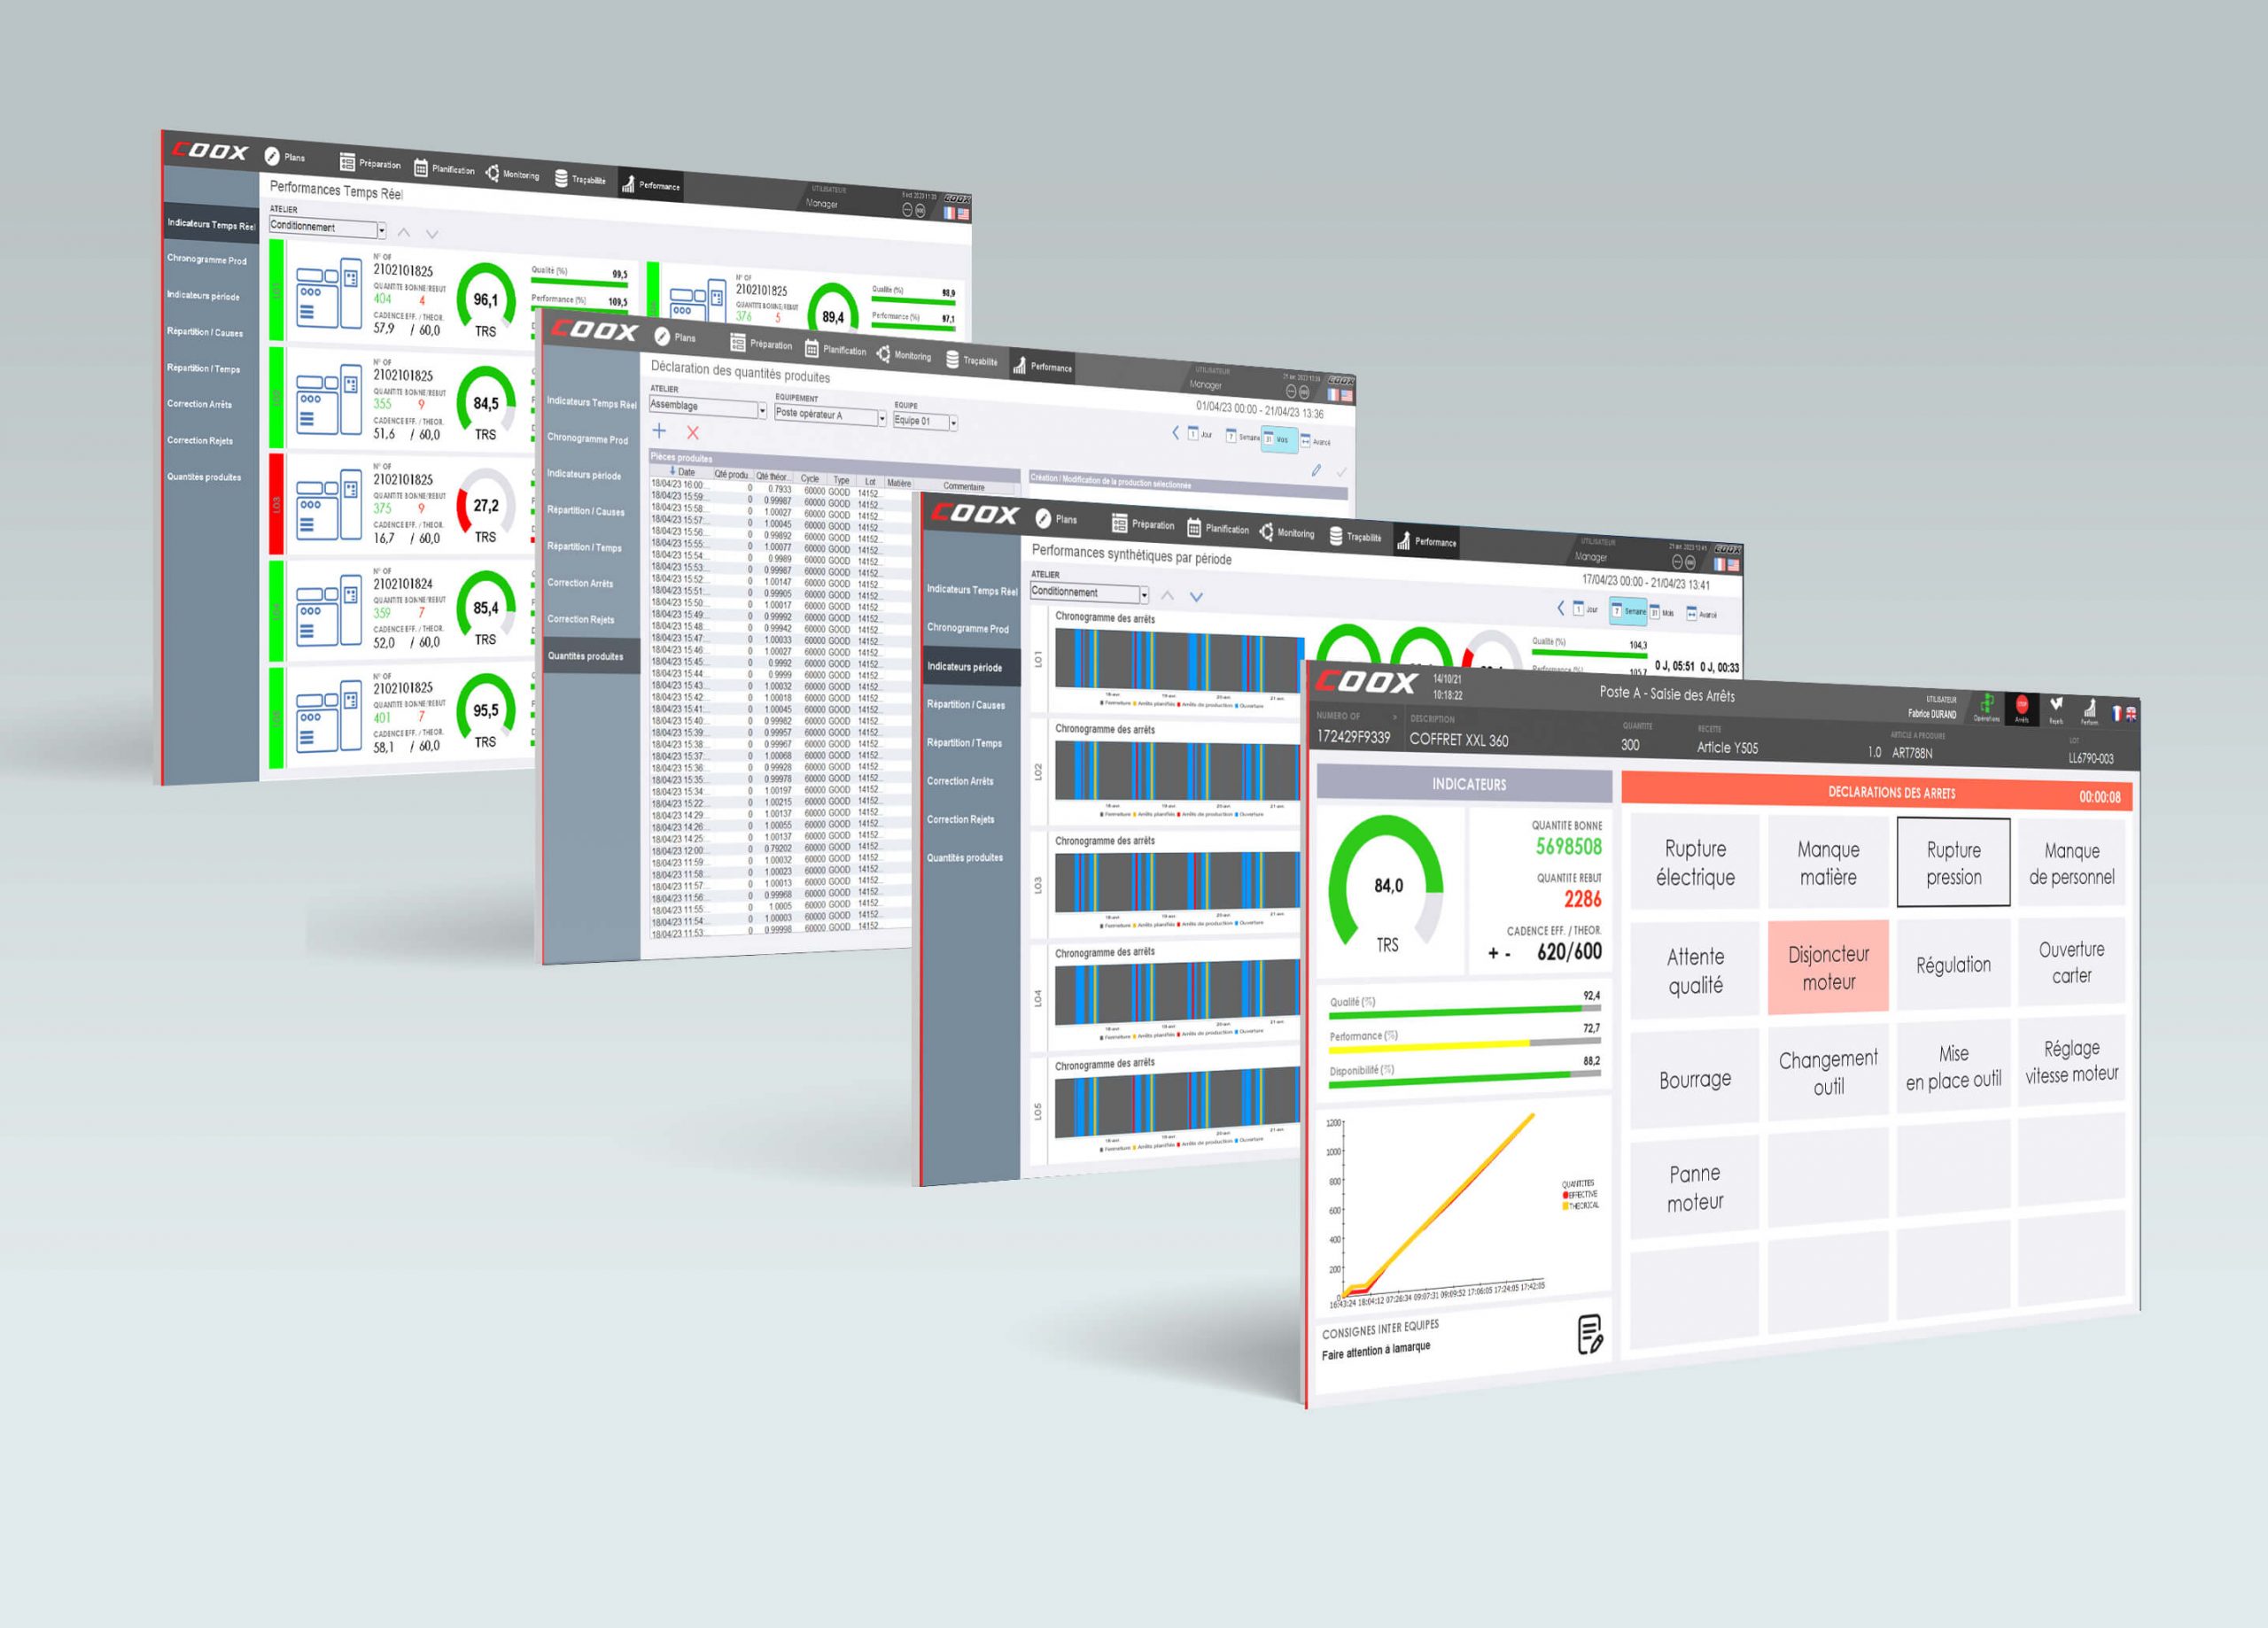
REAL-TIME graph display
The module allows data to be extracted according to various criteria: time, day, week, month, team, batches, work orders, etc. The indicator and status dissemination section ensures real-time dissemination of performance indicators on the intranet and allows on-the-fly generation of PDF reports and high-level graphical reports.
The MESbox QPI module provides direct access to the database model and allows the implementation of custom filters. The company thus has a truly centralized, reliable information system that everyone can share, enabling different operators to react immediately and optimize each of their actions in real time.

CORRESPONDING MODULES OF THE COOX® RANGE
The performance analysis and production indicators calculation functions are based on MESbox QPI module (Quality Performance & Indicators) of the COOX range. It allows you to natively obtain many indicators of production performance: OEE, Operation Availability, Quality rate, Overall return, MTBF, MTTR…and all associated indicators.
- Monitoring quality, quality rates, and discards
- Calculating standard OEE and related indicators, or custom performance indicators
- Calculating standard MTBF (mean time between failures), MTTR (mean time to repair), or custom maintenance indicators
- Monitoring materials consumption and assessments
- Automatic acquisition or manual entry of information
- Support for SQL Server™, Oracle™ and MySQL™ databases
- Output formats: PDF™, Excel™ and texte
- Generation and distribution of dynamic graphs formulated with Excel™
- Predefined models and creation of report models
- Customizable report options established in operations (filters, selections, etc.)