Exploit your data
Panorama H2, the Panorama Historian offer
Collect, archive and analyse your data in a simple and powerful analysis tool available locally or in SaaS mode. With Panorama H2, analyse your operational data and make unlimited use of the information it contains!
- Data
- Analysis
- Indicators
- Dashboards
Reliable and accessible data
Enable your team’s to analyse and report your data
Your data will increase your producty with this versatile solution. Centralise then analyse your data to optimise your operating, maintenance and energy costs. When you use Panorama H2, you’re using a proven solution that helps you focus on improving performance.
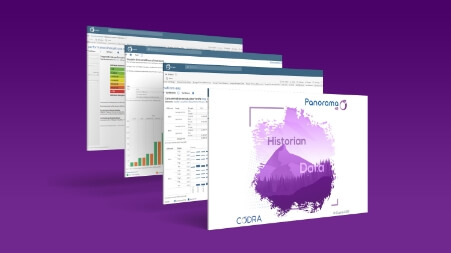
Qualitative data
Harness the power of your data
The purpose of Panorama’s Data Historian is to help users to visualise, understand and use their data for very specific purposes.
Great deployment flexibility
In order to be able to fully leverage your Data Historian, it is important to operate an infrastructure that matches your usage. Are you single-user, multi-user, thick client or thin client, using locally-based software or SaaS?
In fact, it doesn’t matter! Whatever architecture you select to best meet your needs, Panorama H2 remains the same.
The functional scope of Panorama H2 remains the same regardless of your hosting choice.

Local solution
Compatible with applications having from 100 to 300,000 variables
An SQL database to allow greater openness to third-party systems
Works with diverses data types
Processes data as soon as it is acquired
Logs your data according to its nature

Cloud solution
All the H2 server’s power in Cloud mode
No licensing charge, just a subscription
Optimized and contract-based availability rates
Benefit seamlessly from all updates
Your data is hosted in France
A global report of your installations
KPI & data analysis: discover H2 Reporting
H2 Reporting is the module dedicated to the analysis and formatting of Panorama H2 data. Available as a thick client or Web client, this solution provides users with simple and ergonomic analytic interfaces. Queries are generated automatically, so there is no need to have SQL or programming knowledge. This is a solution focused on ease-of-use so the user can view pre-existing reports, then create and disseminate new reports simply using “drag & drop”.
Raw data, consumption calculations, operating times, numbers of operations, numerical statistics (average, cumulative, etc.), alarm cycles. All your operating data can be correlated in a single interface.
Datavisualisation
Explore and display your results graphically in simple, user-friendly analytic interfaces.
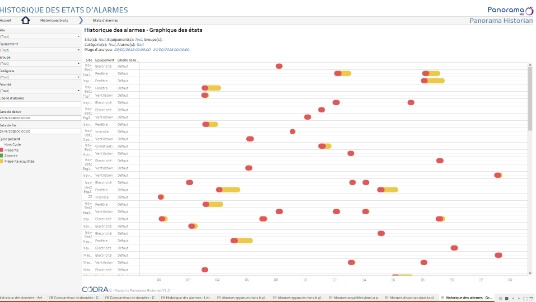
Alarms history
Represent the history of your alarms in a visual and intuitive way to enable you to act effectively.
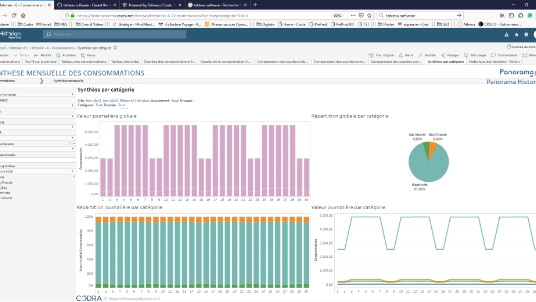
Reports and dashboards
H2 Reporting enables a novice to build their own Reports and dashboards easily, refine intermediate results and build analytical trails independently.
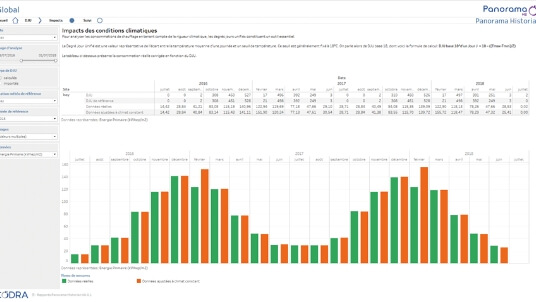
Accessible models
Are your users afraid of having to create their own reports? 50+ ready-to-use reports are already available. Use the data from your Panorama Historian in a user-friendly way.
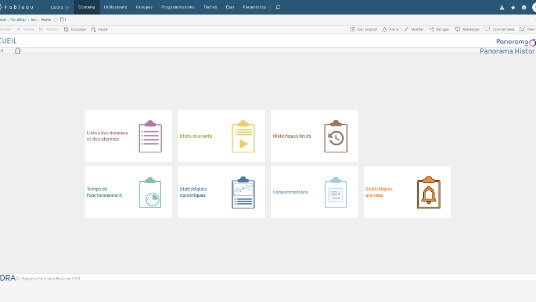
Panorama Studio : 1 design workshop
Simplify your technical teams’ view. Provide them with a single configuration workshop to create and update all of your Panorama applications
Securised Data
Cybersecurity, don’t forget the basics !
Panorama is the first SCADA system certified and approved by the French National Cybersecurity Agency (ANSSI). The experience gained and the techniques used have been implemented to make Panorama H2 secure: Data flow integrity and confidentiality are at the heart of the system. Data is fully partitioned in SaaS mode.


UNLEASH THE POWER OF YOUR DATA AND CONNECT WITH OUR TEAMS !

